Recent federal data show a Memphis regional economy where the urban core still dominates job and wage levels, but surrounding counties are steadily adding employers and payrolls. The picture that emerges from the U.S. Bureau of Labor Statistics’ Quarterly Census of Employment and Wages (QCEW) is not of a metro in freefall or in a surge, but of a slow rebalancing between Shelby County and its neighbors.

Shelby County: High‑wage hub with slightly shrinking job base
Shelby County, home to Memphis and the region’s largest employment base, reported 482,470 covered jobs on an annual‑average basis in 2024.1 That total is down from 493,623 in 2022 and 486,615 in 2023, a two‑year slide that suggests modest erosion in covered employment.1
Even as jobs edged down, Shelby County’s pay levels remained the region’s benchmark. The average weekly wage reached $1,375 in 2024, up from $1,291 in 2022 and $1,349 in 2023.2 At the same time, the county added employers: QCEW shows 24,468 business establishments in 2024, up from 23,518 in 2022 and 24,375 in 2023.3 That combination—fewer jobs but more establishments and higher wages—points to incremental restructuring rather than broad‑based contraction.
Mississippi suburbs: DeSoto’s steady expansion
To the south, DeSoto County, Mississippi, stands out for consistent employment and establishment growth. Covered employment there rose from 70,216 jobs in 2022 to 72,666 in 2024.4 The county’s business base expanded from 3,450 establishments in 2022 to 3,754 in 2024.5
Wage growth has been slower than in Shelby but still positive. DeSoto’s average weekly wage climbed from $824 in 2022 to $879 in 2024.6 That level remains well below Shelby County’s $1,375, underscoring a regional wage gradient in which many employers appear to trade slightly lower pay for a suburban location.
Other Mississippi counties on the Memphis fringe are smaller but show similar patterns of incremental growth. Marshall County recorded 11,291 covered jobs in 2024, up from 10,660 in 2022,7 with establishments rising from 511 to 566 over the same period.8 Average weekly wages there increased from $865 in 2022 to $935 in 2024.9
Tunica County’s employment has been more uneven. Covered jobs increased from 5,730 in 2022 to 5,995 in 2023, then eased to 5,799 in 2024.10 Business establishments in Tunica inched up from 259 to 270 between 2022 and 2024,11 while the average weekly wage moved from $778 in 2022 to $802 in 2024 after peaking at $809 in 2023.12
Tennessee exurbs: Fayette and Tipton add employers and keep pace on pay
East of Memphis, Fayette County, Tennessee, has maintained a relatively flat employment base while adding businesses and income. Covered employment there was 8,162 jobs in 2022, dipped to 8,085 in 2023 and edged up to 8,093 in 2024.13 Over the same period, establishments grew from 724 in 2022 to 823 in 2024.14
Fayette’s average weekly wage climbed from $1,004 in 2022 to $1,098 in 2024,15 roughly matching or slightly exceeding Shelby County’s wage growth rate and placing Fayette near the top of the regional pay scale alongside Shelby.2,15
To the north, Tipton County shows a small but expanding employer base against a modestly shrinking job count. Covered employment declined from 12,360 in 2022 to 11,848 in 2024,16 while the number of establishments rose from 897 to 962 over the same period.17 Average weekly wages increased from $895 in 2022 to $967 in 2024.18
Arkansas side: Crittenden County’s incremental gains
Across the river in Arkansas, Crittenden County has posted slow gains in both jobs and pay. Covered employment increased from 15,750 in 2022 to 16,197 in 2024.19 Establishment counts have been relatively stable, slipping from 1,130 in 2022 to 1,095 in 2023 and then ticking up to 1,096 in 2024.20
Crittenden’s average weekly wage rose from $868 in 2022 to $919 in 2024.21 That level is mid‑pack for the region—above Tunica and DeSoto but below Shelby and Fayette.2,6,12,15,21
Metro‑wide labor market: modest growth, recent monthly volatility
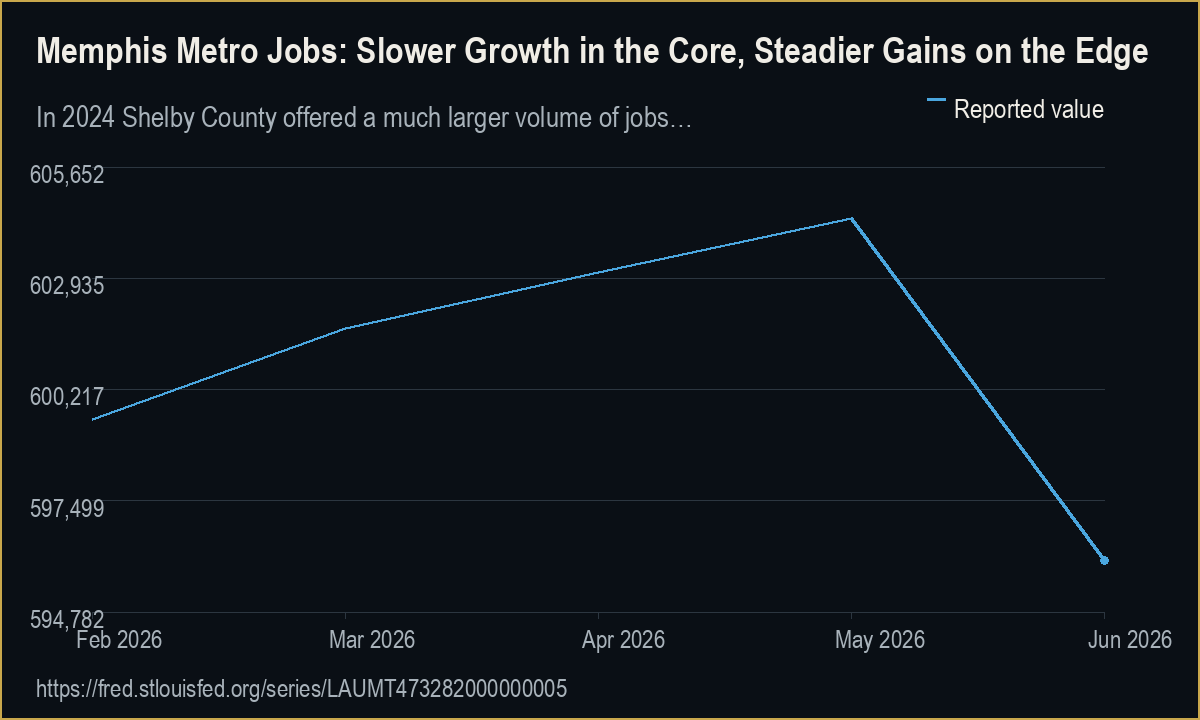
While QCEW data describe where jobs are located and how well they pay, separate household‑based measures provide a view of the broader Memphis TN‑MS‑AR metropolitan labor market. A Federal Reserve Economic Data series explicitly identifies itself as tracking “Employed Persons in Memphis, TN‑MS‑AR (MSA)”.22 For June 2026, that series reports 596,036 employed persons, not seasonally adjusted.23,24 The same source lists 604,398 employed persons in May 2026, 603,074 in April, 601,714 in March, and 599,496 in February, indicating some recent month‑to‑month softness after a spring plateau above 600,000.25
A separate Bureau of Labor Statistics regional table shows the Memphis MSA civilian labor force and employment for January through June 2026. Over that span, the civilian labor force ranges from 628,400 to 630,200, reported in thousands and flagged as preliminary for June,26 while employed persons range from 599,500 to 604,400 (also in thousands, preliminary for June).27 Unemployment counts move between 25,800 and 30,200,28 with the unemployment rate reported at 4.5% to 4.8% in those first six months of 2026.29
One third‑party summary notes that the Memphis area lost 1,300 jobs in June 2026,30,31 and adds that over the past five years the Memphis TN‑MS‑AR metro has averaged about 153 new jobs per month.32 Those figures are external estimates, but they align directionally with the official data showing a labor market that is expanding over the longer term while experiencing month‑to‑month volatility.
Institutional focus on growth and workforce
Local development organizations are positioning themselves around this pattern of slow growth and regional rebalancing. The Economic Development Growth Engine (EDGE) for Memphis and Shelby County is described as the economic development agency for the City of Memphis and Shelby County, created in 2011 and charged with coordinating public resources to drive growth.33 According to the City of Memphis, EDGE “provides and coordinates public resources to drive economic development through ongoing economic activities and projects that provide real value to the community and provide a strong foundation for future economic growth.”34
The Greater Memphis Chamber similarly defines its mission as driving the region’s business agenda through economic and workforce development and pro‑growth advocacy.35 The Chamber’s board and staff state they will continue to focus on economic development, workforce initiatives, and supporting the business community throughout Greater Memphis.36 In recognition of that work, the Chamber reports receiving a 2025 CiCi Community Impact Award for its role in attracting Silver Hills Bakery to Rossville, Tennessee.37
What this means for property and local strategy
From a property‑market perspective, the verified data support several cautious observations:
- Jobs and wages remain concentrated in Shelby County, but suburban and exurban counties are steadily adding establishments and raising pay, especially DeSoto, Marshall, and Fayette.1–21
- Recent metro‑level employment has been broadly stable with low‑to‑mid‑single‑digit unemployment, suggesting demand fundamentals that are neither overheated nor deeply distressed as of mid‑2026.23,25–29
- Local institutions are explicitly prioritizing economic and workforce development, which could influence future siting decisions for employers and, in turn, space demand.33–37
Because all of the quantitative evidence here is drawn from government statistical releases and clearly identified third‑party summaries, it does not cover every relevant indicator for property decisions (such as sector‑specific employment, migration flows, or construction activity). Any forward‑looking interpretation beyond these documented trends would require additional data.