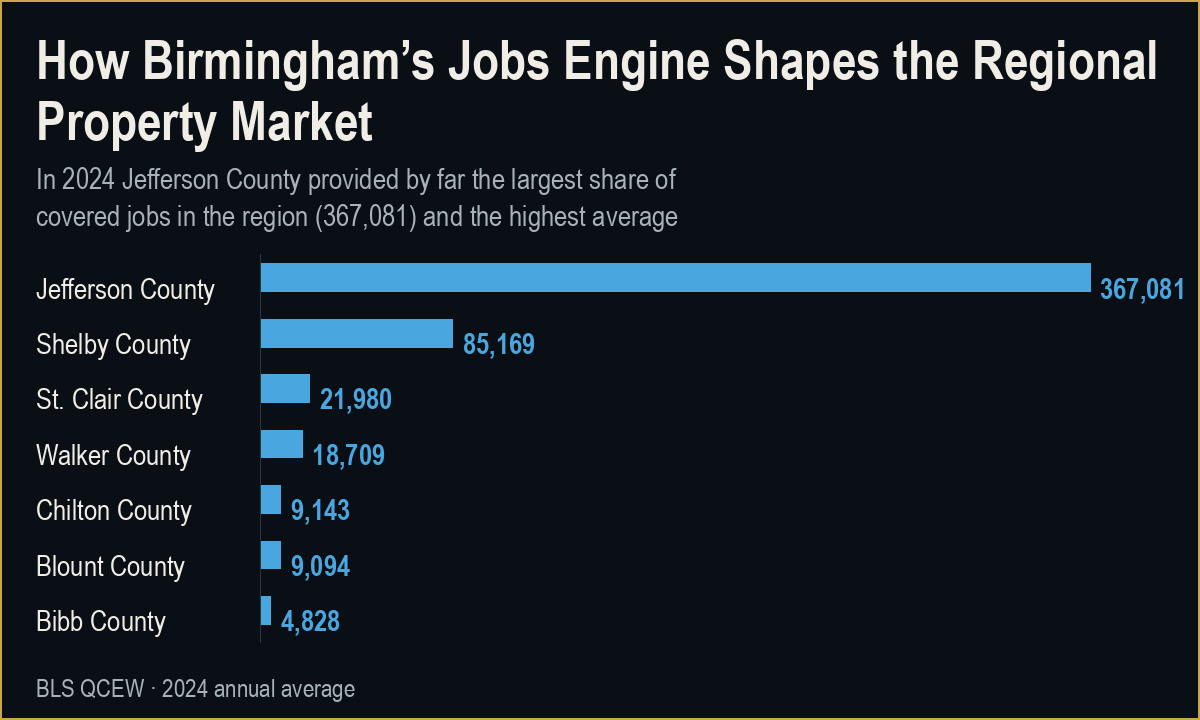
Recent data from the U.S. Bureau of Labor Statistics’ Quarterly Census of Employment and Wages (QCEW) highlight how employment, wages and business establishments are distributed across Greater Birmingham’s core counties. The numbers underline Jefferson County’s role as the region’s anchor labor market, while showing how nearby counties contribute jobs at different wage levels.
In 2024, Jefferson County recorded 367,081 covered jobs on an annual average basis.1 That figure has risen from 356,742 in 2022 and 362,788 in 2023, indicating steady employment growth over the three-year period.1 The county also reported 22,923 business establishments in 2024, up from 21,422 in 2022 and 22,427 in 2023.11 According to the same dataset, Jefferson County’s average weekly wage reached $1,376 in 2024, after increases from $1,276 in 2022 and $1,331 in 2023.2
Immediately south, Shelby County remains the largest suburban employment base in the region’s core. In 2024, Shelby County reported 85,169 covered jobs, compared with 86,332 in 2022 and 85,595 in 2023, indicating a modest net decline over the period.3 The number of business establishments increased over the same years, from 6,809 in 2022 to 6,982 in 2023 and 7,251 in 2024.12 Shelby County’s average weekly wage was $1,284 in 2024, up from $1,223 in 2022 and $1,246 in 2023.4
To the east, St. Clair County has a smaller but growing employment base. Covered employment there increased from 19,970 jobs in 2022 to 21,121 in 2023 and 21,980 in 2024.5,13 Business establishments rose from 1,769 in 2022 to 1,827 in 2023 and 1,943 in 2024.14 St. Clair’s average weekly wage was $989 in 2024, up from $920 in 2022 and $957 in 2023.10,15
Other adjacent counties show smaller job bases and lower average wage levels relative to Jefferson and Shelby. Chilton County to the south recorded 9,143 covered jobs in 2024, following 9,047 in 2022 and 9,227 in 2023.6,19 The county had 922 business establishments in 2024, up from 856 in 2022 and 913 in 2023.20 Chilton’s average weekly wage was $915 in 2024, compared with $854 in 2022 and $897 in 2023.11,21
Blount County to the north posted 9,094 covered jobs in 2024, up from 8,726 in 2022 and 8,857 in 2023.7,16 The number of business establishments there increased from 896 in 2022 to 932 in 2023 and 956 in 2024.17 Blount County’s average weekly wage reached $879 in 2024, after rising from $825 in 2022 and $840 in 2023.18
West of Birmingham, Walker County had 18,709 covered jobs in 2024, compared with 17,790 in 2022 and 18,468 in 2023.8,22 Business establishments in Walker County edged up from 1,498 in 2022 to 1,549 in 2023 before settling at 1,536 in 2024.23 The county’s average weekly wage was $936 in 2024, following $867 in 2022 and $903 in 2023.9,24
Bibb County to the southwest is the smallest labor market in this group. It reported 4,828 covered jobs in 2024, essentially flat compared with 4,836 in 2022 and 4,815 in 2023.8,19 Business establishments rose from 404 in 2022 to 433 in 2023 and 445 in 2024.26 Bibb County’s average weekly wage was $1,020 in 2024, up from $932 in 2022 and $986 in 2023.27
These county-level figures sit within a broader regional context. The Birmingham Business Alliance describes Greater Birmingham as “one connected economy,” where “talent, jobs, and investment move across city and county lines every day, creating a regional advantage that gives businesses the workforce, infrastructure, and market access they need to grow.”30 The same document notes that “every day, thousands of people cross city and county lines to work in Greater Birmingham,” citing the movement of workers across jurisdictional boundaries.
32 It also emphasizes Birmingham’s central location and access to interstate highways, rail and air transportation as factors that place businesses “within easy reach of major markets across the Southeast and beyond.”31 These are statements by the organization, rather than quantified findings in the QCEW data.
Within the City of Birmingham, the Department of Innovation and Economic Opportunity describes its role as “shaping Birmingham’s future by connecting our people, businesses, assets, and opportunities to the markets and investments that drive sustainable growth.”25 According to the department, it “work[s] to strengthen homegrown businesses, attract and retain high-growth industries, cultivate a skilled and competitive workforce, and position Birmingham for new investment and development,” and it frames these efforts as aligning “local strengths with regional and global opportunities.”26,27 The department also states that it focuses resources “where they have the highest multiplier effect—supporting businesses ready to scale and industries ready to invest.”28 These descriptions outline the city’s stated economic-development strategy but do not quantify its impact in the employment and wage data summarized above.
Other institutions and programs reference economic development explicitly. The University of Alabama at Birmingham reports that it is “building new facilities and renovating existing spaces” to enhance opportunities across its mission pillars, including economic development among education, research and innovation, community service and patient care.36 Separately, the federal Economic Development Administration notes that the Reinvest Birmingham Recompete Plan, led by the City of Birmingham, will receive approximately $20 million to support specified neighborhoods in and near northwest Birmingham, with funding aimed at workforce training and support for entrepreneurs in those areas.35 The EDA document characterizes these neighborhoods as having experienced significant challenges, including low labor-force participation among prime-age residents, and describes the funding as a response to those conditions.35
City community-development policy also intersects with economic development. The City of Birmingham’s Community Development department states that it provides “programs focused on improving housing, neighborhoods, and local businesses” and that its portfolio includes “small business loans and economic development initiatives.”33,34 The same document notes that Community Development Block Grant funds may be used for a wide range of housing, community and economic development activities, and may be classified under up to 90 different activity codes, depending on how the city chooses to deploy them.34
Taken together, the QCEW data show a regional economy in which Jefferson County is the dominant employment and wage center, surrounded by smaller county labor markets with differing wage levels and establishment counts. The additional documents from local, state and federal sources describe a set of economic-development strategies and investments that are intended to influence how that regional job base evolves, particularly in distressed neighborhoods. The current evidence establishes the size and recent trajectory of employment, wages and establishments, and documents stated strategies and planned investments; it does not, on its own, establish causal links between specific programs and the employment or wage levels reported in the QCEW figures.