
Recent federal labor data and local economic-development reports suggest a Memphis-area economy that is softening at the margins but still anchored by a large core job base and an active business-support ecosystem. The picture that emerges is not of a sharp downturn, but of a metro area navigating slower month‑to‑month job growth while public and private institutions work to sustain expansion.

Shelby County remains the region’s employment center
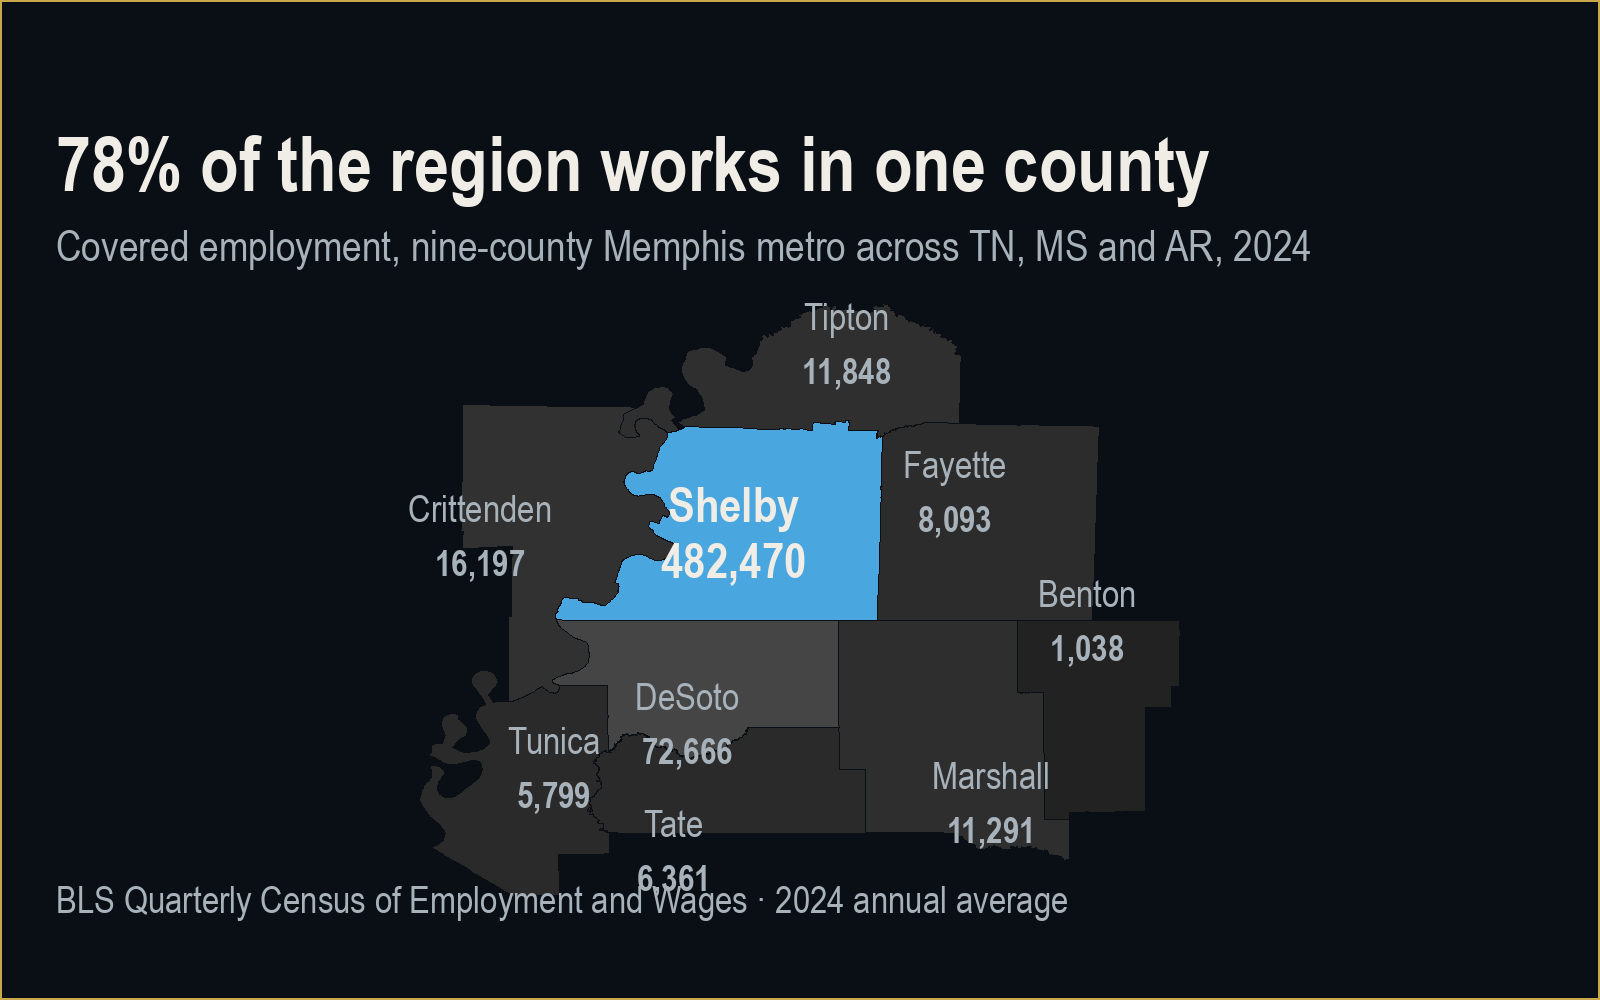
Within the Memphis TN–MS–AR metro, Shelby County, Tennessee is the dominant employment hub. Bureau of Labor Statistics Quarterly Census of Employment and Wages (QCEW) annual averages report that in 2024 Shelby County had 482,470 covered jobs, down from 493,623 in 2022 and 486,615 in 2023.1 Over the same period, the number of business establishments in the county edged up from 23,518 in 2022 to 24,375 in 2023 and 24,468 in 2024.1 That combination—slightly fewer covered jobs alongside a slowly rising establishment count—indicates a modest cooling in job levels, not a collapse in the local business base.
Wage data underline Shelby County’s relatively high‑earning profile in the regional context. The county’s average weekly wage reached $1,375 in 2024, up from $1,291 in 2022 and $1,349 in 2023.1 This puts Shelby clearly above surrounding suburban and rural counties in the tri‑state metro in terms of average pay, based on the same QCEW series.
Suburban counties: smaller bases, varied trends
Surrounding Shelby County, a ring of smaller Tennessee, Mississippi and Arkansas counties contributes more modest employment counts and generally lower wage levels.
- DeSoto County, Mississippi — A key suburban job center south of Memphis, DeSoto County had 72,666 covered jobs in 2024, up from 70,216 in 2022 and 71,103 in 2023.2 The number of business establishments rose from 3,450 in 2022 to 3,623 in 2023 and 3,754 in 2024.2 Average weekly wages increased from $824 in 2022 to $855 in 2023 and $879 in 2024, remaining well below Shelby County’s average.1,2
- Fayette County, Tennessee — East of Memphis, Fayette County’s covered employment was 8,093 in 2024, essentially flat compared with 8,162 in 2022 and 8,085 in 2023.3 Establishments grew from 724 (2022) to 785 (2023) and 823 (2024).3 Average weekly wages rose from $1,004 (2022) to $1,060 (2023) and $1,098 (2024), still below Shelby County but above some Mississippi and Arkansas neighbors.1,3
- Tipton County, Tennessee — North of Shelby, Tipton County shows a mild employment slide: 12,360 covered jobs in 2022, 12,061 in 2023, and 11,848 in 2024.4 Business establishments nonetheless increased from 897 (2022) to 934 (2023) and 962 (2024).4 Average weekly wages moved from $895 (2022) to $966 (2023) and $967 (2024).4
- Marshall County, Mississippi — Covering a portion of the logistics belt southeast of Memphis, Marshall County recorded 11,291 covered jobs in 2024, up from 10,660 in 2022 and 11,225 in 2023.5 Establishments increased from 511 (2022) to 538 (2023) and 566 (2024).5 Average weekly wages rose from $865 (2022) to $903 (2023) and $935 (2024).5
- Tunica County, Mississippi — Tunica, long associated with tourism and gaming, posted 5,799 covered jobs in 2024, compared with 5,730 in 2022 and 5,995 in 2023, indicating some year‑to‑year fluctuation rather than consistent growth.6 Establishments in the county edged up from 259 (2022) to 269 (2023) and 270 (2024).6 Average weekly wages moved from $778 (2022) to $809 (2023) and then slightly down to $802 in 2024.6
- Crittenden County, Arkansas — To the west across the Mississippi River, Crittenden County’s covered employment increased from 15,750 in 2022 to 15,861 in 2023 and 16,197 in 2024.7 Establishment counts remained essentially stable: 1,130 in 2022, 1,095 in 2023 and 1,096 in 2024.7 Average weekly wages rose from $868 (2022) to $888 (2023) and $919 (2024).7
Across these counties, the data support a consistent pattern: modest growth or slight erosion in job counts, gradual increases in the number of establishments, and generally rising wages from 2022 through 2024. None of the available series suggest a dramatic break in trend, but they also do not point to rapid employment expansion.
Metro-level labor force: modest softening by mid‑2026
The metro‑wide household survey data, which capture the Memphis TN–MS–AR metropolitan statistical area as a whole, offer a more recent snapshot. According to FRED, which republishes U.S. Bureau of Labor Statistics data, the number of employed persons in the Memphis MSA reached 596,036 in June 2026, in units of persons and on a not‑seasonally‑adjusted basis.8 FRED identifies the Current Population Survey (CPS), also known as the household survey, as the source of these figures.8
BLS’s Economy at a Glance table for the Memphis MSA reports complementary CPS‑based figures in thousands of persons for the first half of 2026. Civilian labor force counts for January through June 2026 are listed as 629.7, 629.2, 628.4, 629.0, 630.2 and a preliminary 626.2, respectively.9 Over the same months, employment is reported at 601.6, 599.5, 601.7, 603.1, 604.4 and a preliminary 596.0.9 Unemployment counts are 28.1, 29.7, 26.6, 25.9, 25.8 and a preliminary 30.2.9 The resulting unemployment rates are shown as 4.5%, 4.7%, 4.2%, 4.1%, 4.1% and a preliminary 4.8% for June.9
Read together, these series suggest a modest softening in mid‑2026: employment in the CPS data dips between May and June, while the unemployment rate ticks up from 4.1% to a preliminary 4.8%.9 Because the BLS series are not seasonally adjusted in this presentation and the June figures are identified as preliminary, users should treat month‑to‑month changes cautiously and watch for revisions.
Short‑term job losses in context
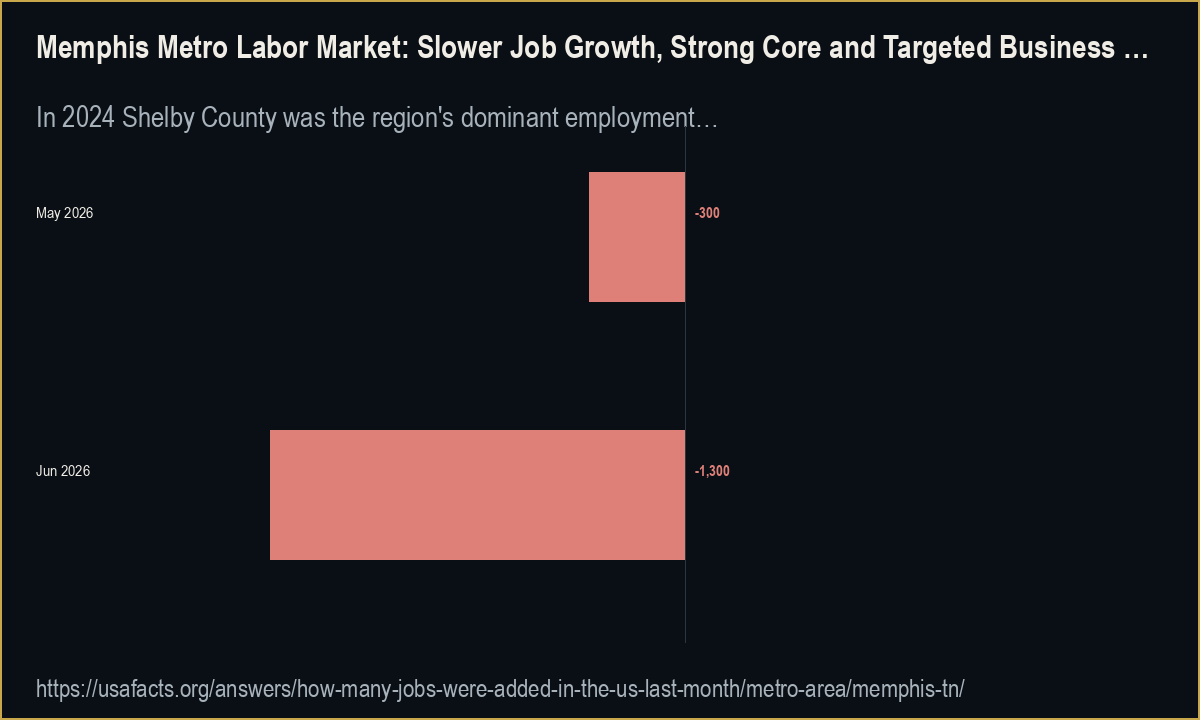
An alternative compilation of BLS data by USAFacts frames recent changes in metro payroll jobs. USAFacts reports that the Memphis, Tennessee area “lost 1,300 jobs in June 2026.”10 It notes that this loss was larger than the 300 jobs lost in May 2026.10 Placing this in a longer‑term perspective, the same source states that over the five‑year period from July 2021 to June 2026 the Memphis area gained jobs in 31 out of 60 months, and that June 2026 ranked as the 13th‑lowest month for job growth in that span.10
Those comparisons indicate that while June 2026 was a relatively weak month by recent historical standards, it did not represent the single worst point in the five‑year window, and that the overall period still saw more months of job gains than losses according to this tabulation.10 Users should note that USAFacts summarizes official government series but is not itself a government publisher, so it is best treated as a secondary interpreter of BLS data.10
Local institutions working to sustain business growth
Alongside these labor‑market indicators, regional institutions are actively pursuing business and workforce development strategies that may influence future employment trajectories, though the available evidence does not yet link them to specific job totals.
On the entrepreneurial side, the City of Memphis and the Economic Development Growth Engine for Memphis and Shelby County (EDGE) have launched an initiative framed as a marketing campaign to “support and elevate entrepreneurs across the city.”11 As part of this effort, an Expo convened “dozens of small‑business owners, aspiring entrepreneurs and economic development partners” to explore resources including EDGE’s Small Business Loan Program.11 According to the city’s account, since that loan program began, “more than 120 businesses have received more than $2.7 million in forgivable loans.”11
EDGE itself was created in 2011 through a joint resolution of the Memphis City Council and the Shelby County Commission and is described as “the economic development agency for the City of Memphis and Shelby County coordinating public resources to drive growth.”11 This underscores its role as a central public‑sector tool for business retention and expansion in the region, though the material reviewed here does not quantify resulting job creation.
The private sector is also organized around economic‑development goals. The Greater Memphis Chamber, a privately funded nonprofit “dating back to 1838,” is characterized as the region’s “lead economic development organization” and “Voice of Memphis Business” on policy issues across levels of government.12 A Chamber release states that its Board of Directors and staff will “continue to focus on our core mission of economic development, workforce initiatives, and supporting the business community throughout Greater Memphis.”12
Recognition from outside the region highlights specific wins. The Chamber reports receiving the 2025 CiCi Community Impact Award from Trade & Industry Development magazine for its role in “successfully attracting Silver Hills Bakery to Rossville, Tennessee.”12 While this citation does not provide numerical job counts tied to the project, it does document external validation of a notable recruitment effort in the broader Memphis area.
What to watch
Looking ahead, several metrics and developments merit close tracking:
- Revisions to CPS and payroll data — Because the BLS employment and unemployment figures for mid‑2026 are preliminary and not seasonally adjusted, final revisions may alter the apparent severity of recent job losses or labor‑force changes.9
- Continuation of QCEW trends — The gradual shift toward slightly higher establishment counts but flat or modestly lower covered employment in several counties could signal changing average firm size or sector mix. Future QCEW releases will clarify whether these are short‑term fluctuations or a longer‑term pattern.1,2
- Impact of entrepreneurship and incentive programs — EDGE’s forgivable‑loan activity, which has already reached more than 120 businesses and more than $2.7 million in support, may have cumulative effects on small‑business survival and hiring that current high‑level labor data do not isolate.11
- Project‑specific outcomes — High‑profile business attractions such as Silver Hills Bakery’s move to Rossville, for which the Greater Memphis Chamber received a 2025 community‑impact award, provide case studies of how individual projects contribute to the regional job base once detailed employment figures become available.12
At present, the evidence supports a characterization of the Memphis metro labor market as steady but not booming: its largest county maintains a substantial and relatively well‑paid employment base, peripheral counties are experiencing gradual wage growth with mixed job trends, and both public and private institutions are explicitly focused on economic development and workforce support. The full impact of those initiatives on future employment levels will become clearer as more data are released.
Sources
- U.S. Bureau of Labor Statistics. Quarterly Census of Employment and Wages, annual averages — Shelby County, Tennessee. 2024 View source
- U.S. Bureau of Labor Statistics. Quarterly Census of Employment and Wages, annual averages — DeSoto County, Mississippi. 2024 View source
- U.S. Bureau of Labor Statistics. Quarterly Census of Employment and Wages, annual averages — Fayette County, Tennessee. 2024 View source
- U.S. Bureau of Labor Statistics. Quarterly Census of Employment and Wages, annual averages — Tipton County, Tennessee. 2024 View source
- U.S. Bureau of Labor Statistics. Quarterly Census of Employment and Wages, annual averages — Marshall County, Mississippi. 2024 View source
- U.S. Bureau of Labor Statistics. Quarterly Census of Employment and Wages, annual averages — Tunica County, Mississippi. 2024 View source
- U.S. Bureau of Labor Statistics. Quarterly Census of Employment and Wages, annual averages — Crittenden County, Arkansas. 2024 View source
- Federal Reserve Bank of St. Louis (FRED). Economic Data series LAUMT473282000000005 View source
- U.S. Bureau of Labor Statistics. Economy at a Glance View source
- USAFacts. Jobs data explainer View source
- City of Memphis. City of memphis edge launch entrepreneurship city initiative View source
- Greater Memphis Chamber. Releases View source