
Memphis metro nonfarm employment stood at 650,000 jobs in June 2026. That single figure from the U.S. Bureau of Labor Statistics counts every payroll job in the metropolitan area — every warehouse shift, every hospital rotation, every office desk — and it is the most useful number available for judging how the regional economy is actually doing, as opposed to how it is being described.

What the data shows
The recent movement is small and downward. Employment measured 653,600 in March 2026 and 650,000 in June, a decline of roughly 3,600 jobs across the spring. Read alone, that is a modest drift rather than a rupture.
Read across a decade, it is more interesting. The metro added jobs steadily through 2017 and 2019, lost a large share in the 2020 collapse, recovered through 2021 and 2022, and then peaked — and the peak has not been retaken. Employment in June 2026 sits below where it stood in June 2023.
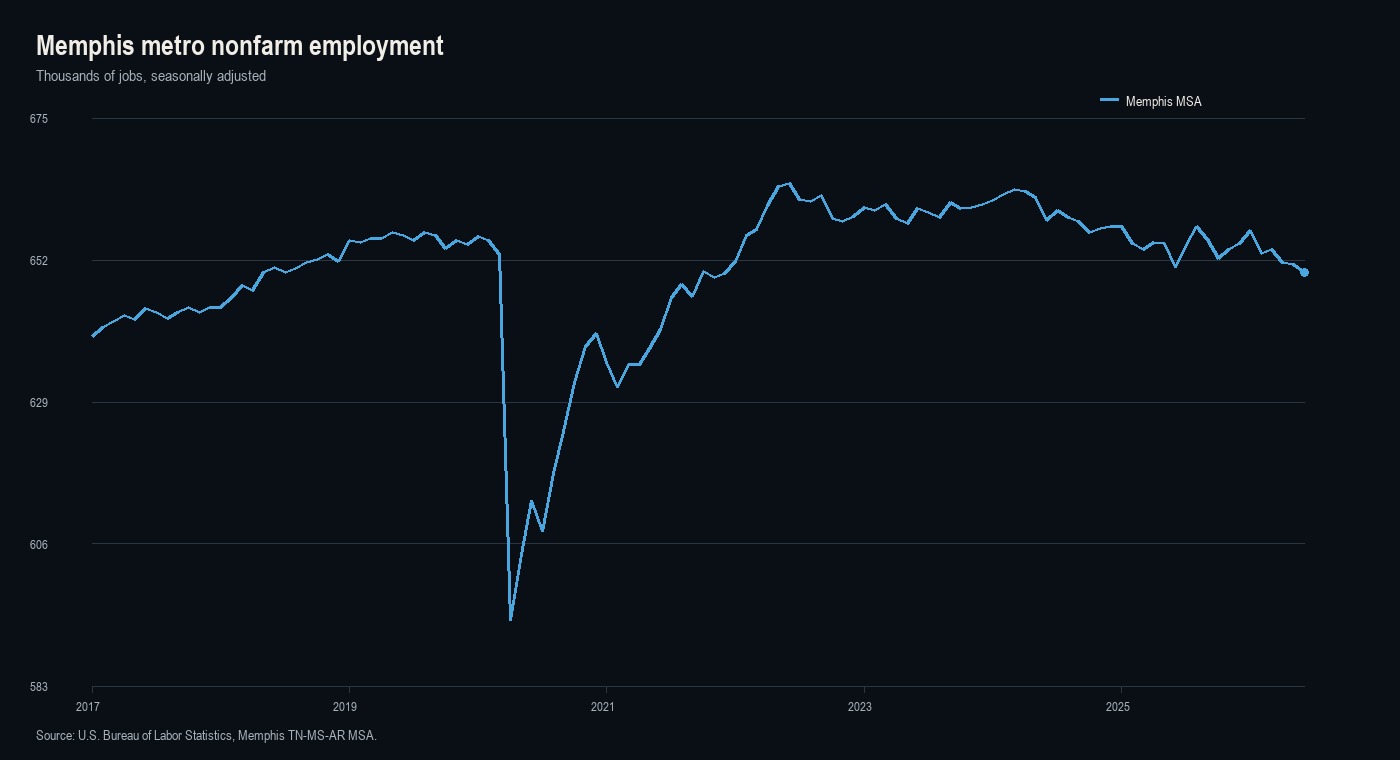
The shape matters more than any single month. A metro that is adding capacity but not adding payroll looks exactly like this: a long plateau with a slow tilt downward, punctuated by announcements that never quite arrive in the series.
What the data does not show
Payroll employment is a count of jobs, not of prosperity. It does not distinguish a warehouse shift from a research post, and it says nothing about wages, hours or whether a household can cover rent on what those jobs pay. A metro can hold employment flat while the mix beneath it changes substantially.
It also excludes work that is genuinely happening. Construction contractors staffing a project site may sit in another metro’s payroll, or in self-employment that this series never counts. Contract and staffing-agency arrangements can appear under a different industry than the workplace a person reports to. None of that is a flaw in the data — it is the definition — but it means a region can be visibly busy while the number stays still.
The household survey tells a consistent story
The payroll count is one of two federal measures, and the second — the household survey — moves the same direction over the same months. Between January and June 2026 the metro’s civilian labor force went from 629,700 to a preliminary 626,200, employment from 601,600 to a preliminary 596,000, and unemployment from 28,100 to a preliminary 30,200. The unemployment rate rose from 4.5 percent to a preliminary 4.8 percent.
Two things are worth noting. The labor force shrank while unemployment rose, which is the less encouraging combination: fewer people looking, and more of those still looking without work. And the June figures are preliminary, which is precisely why a single month should not be read as a trend.
Why announcements and payroll move on different clocks
The most common error in local economic coverage is treating an announcement as an employment event. It is not. It is the first stage of a sequence that ends, sometimes years later, in this series.

Each step consumes real time. Permits and construction can run for years, and the labor involved is often contractors rather than payroll headcount at the announcing employer. A finished building represents capacity, and capacity is real well before anyone is hired into it. Hiring itself usually arrives in phases. Only at the end does the metro employment series register anything at all.
This is why a region can accumulate an extraordinary run of investment announcements while its payroll number stays flat, and why neither fact contradicts the other. We examined that pattern in detail in Memphis Keeps Winning Billion-Dollar Projects. When Do the Jobs Follow? — this entry is the current reading of the number that project pipeline eventually has to move.
What would signal a real turn
A single month is noise. What would constitute evidence:
- Direction sustained across several months, not one print that reverses on revision. BLS revises these figures, and early estimates move.
- Breadth across industries rather than a single sector carrying the total. A metro gaining in one industry and losing in three is not recovering.
- Recovery of the prior peak. Until employment reclaims its 2023 level, the region is still filling a hole rather than growing past it.
- Labor force moving with employment. A falling unemployment rate driven by people leaving the labor force is not the same as one driven by hiring.
What this means if you live or work here
For someone already working in Memphis, a flat payroll number is not a reason for alarm; it is a reason to read job postings skeptically when they are framed as regional momentum. For someone relocating, it argues for anchoring the decision to a specific employer and a specific site rather than to the general impression that a region is booming — the jobs that exist are not evenly distributed, and where the major employers actually sit matters more than the metro total.
For a household weighing where to rent, the practical implication is straightforward: proximity to an actual, currently staffed workplace is worth more than proximity to an announced one.
Where this fits
This entry is a snapshot of the number. The broader question of what Memphis is building, and why capital and payroll are moving on different schedules, is the subject of the Digital Delta analysis. Both belong to the Memphis Living Atlas, which tracks how this region actually works rather than how it is marketed.
Sources: U.S. Bureau of Labor Statistics, Memphis TN-MS-AR metropolitan statistical area, total nonfarm employment, seasonally adjusted, via the Federal Reserve Bank of St. Louis (FRED) and BLS metropolitan area publications. Figures are as of the June 2026 reference month and are subject to revision.